
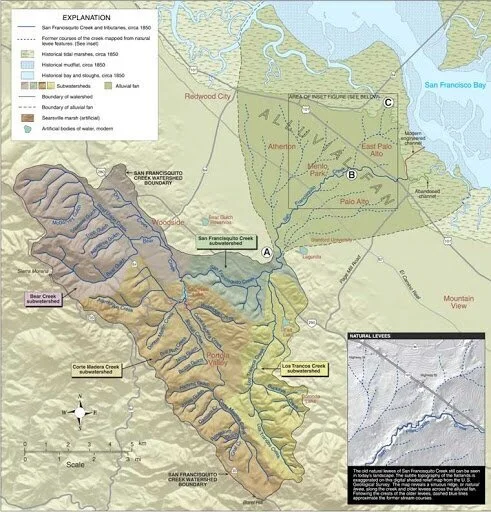
About the Watershed
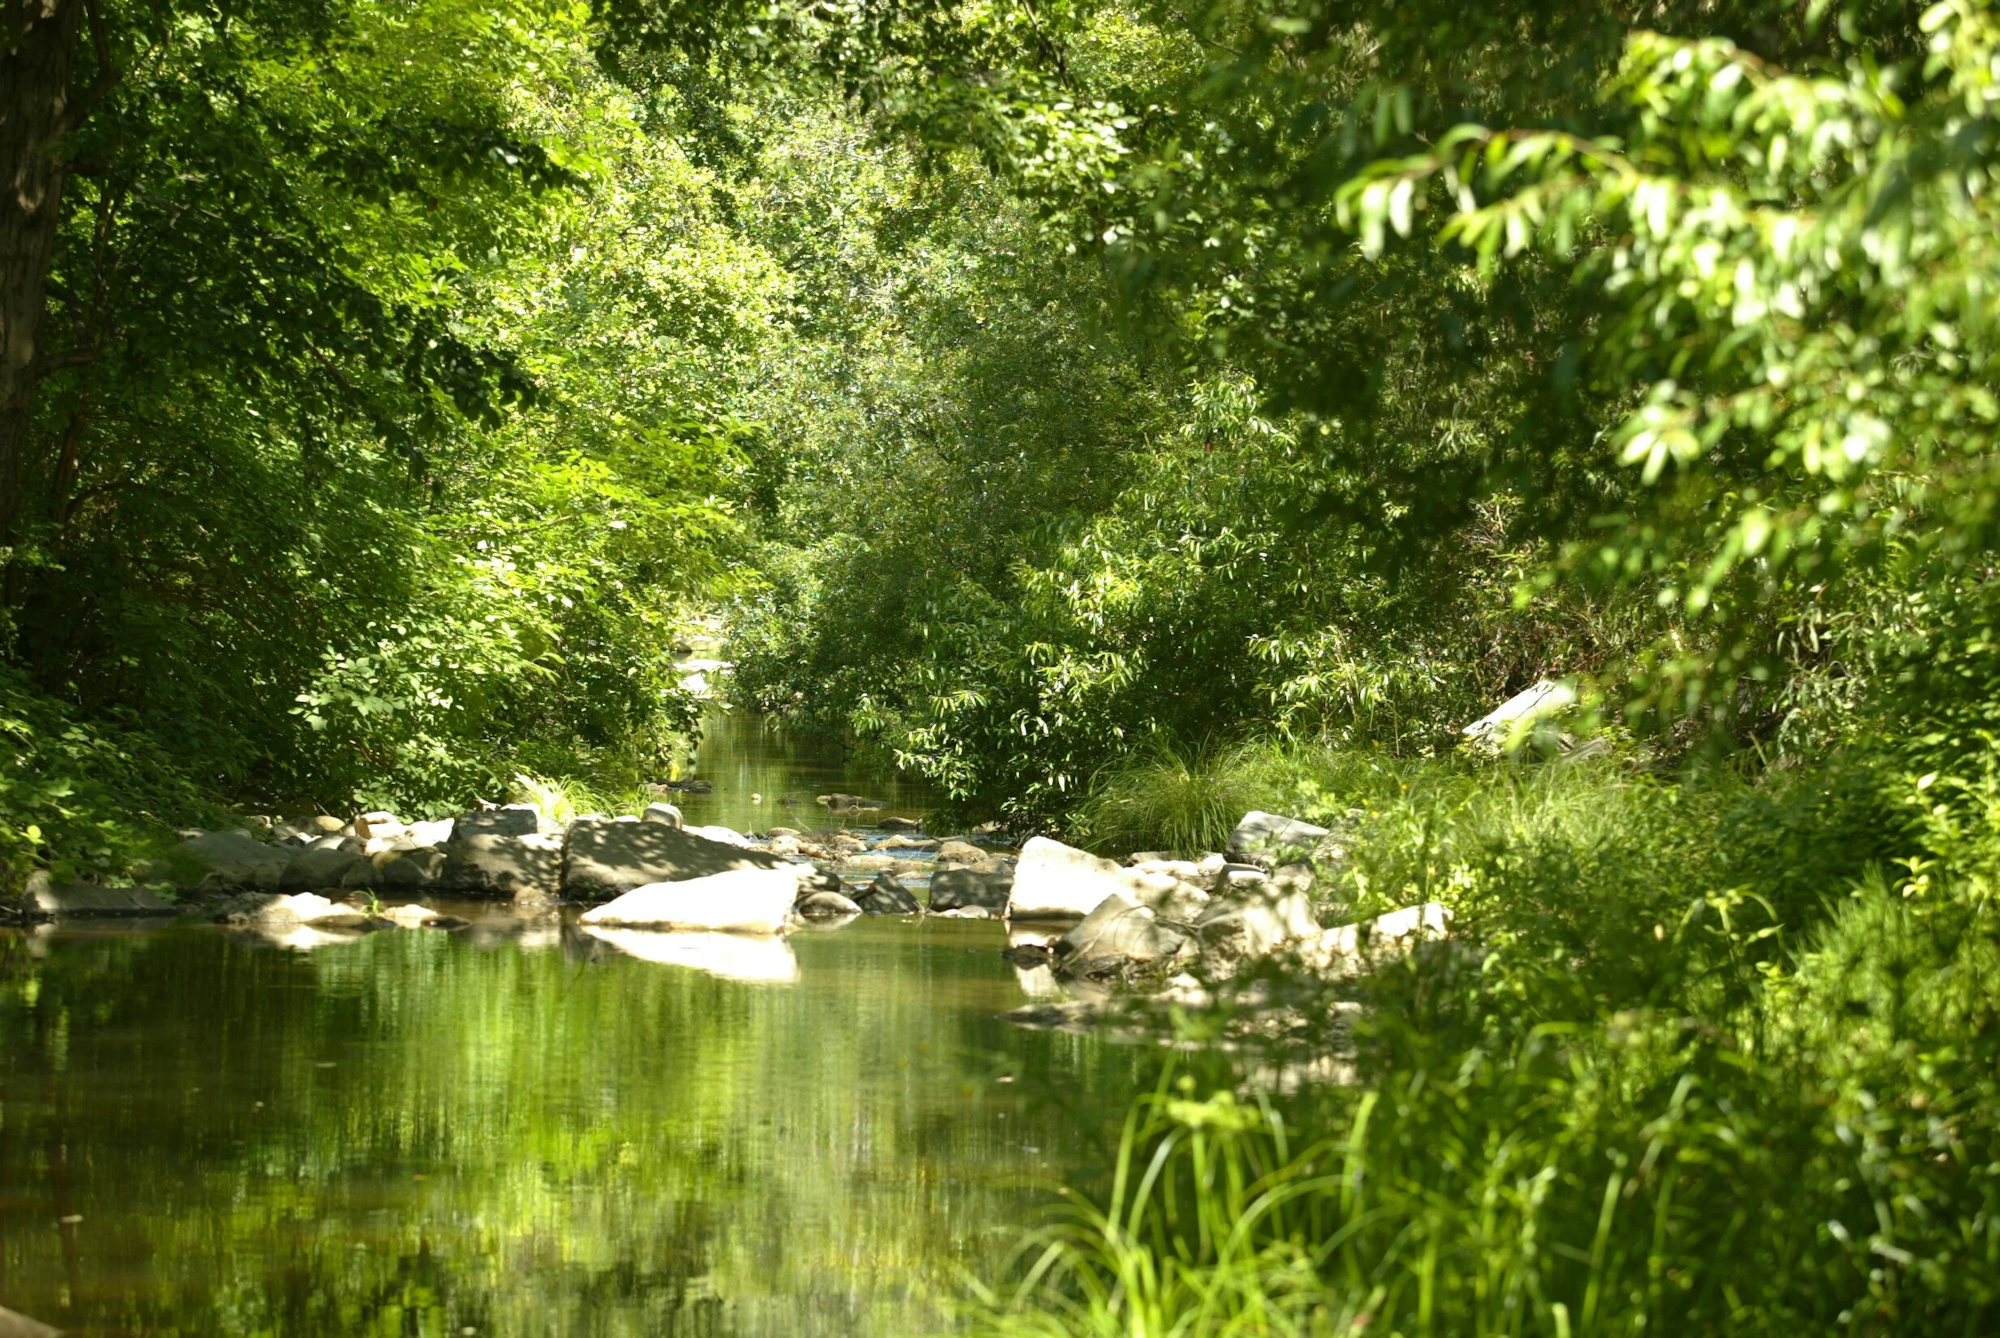
San Francisquito Creek is the last free-flowing urban creek on the southern Peninsula of San Francisco Bay. The watershed and floodplain of San Francisquito Creek encompass almost 40 square miles, originating on the east-facing slopes of the Santa Cruz Mountains and flowing to the San Francisco Bay.
The tributaries of the creek include at least 22 named streams including Bear Creek, Corte Madera Creek, and Los Trancos Creek. The steep slopes of the Santa Cruz Mountains are covered in redwood, madrone and oak forests and are minimally developed. These tributary creeks cross the San Andreas fault where winter storm flows pick up rock, gravel and mud from the San Andreas Fault Zone and carry it downstream.
The tributaries of Bear Creek and Corte Madera Creek join to form the San Francisquito Creek mainstem just below Searsville Lake. This area is minimally developed and dominated by oak woodlands. Part of this area is within Stanford’s Jasper Ridge Biological Preserve.
Over the millennia, the sediments carried by the creek have built up an alluvial fan, which spreads out across the valley floor. This part of the watershed is characterized by scattered oaks and open grasslands and is now mostly urbanized. The creek is known as a “perched creek” because it sits high on the alluvial fan it has built over the eons, rather than in a valley or ravine. The creek has also built up high banks, which form natural levees. California Coast Live Oak and California Bay Laurel trees grow along the top of the creek’s banks. Willow trees are common in the creek channel. Former ancient creek courses and levee banks can be seen in the topographic details of the alluvial fan. This means that when the creek floods, water flows out across the landscape, finding a path downhill, away from the creek. Flooding is a natural event, occurring regularly in a natural creek system. It becomes an urban hazard when homes, businesses and roads cover the banks and flat lands around the creek.
The tributary creeks in the upper watershed flow year-round. Once the creek reaches its alluvial fan, water quickly soaks into the porous soil and gravel. Although this replenishes groundwater, it means the creek that flows across the alluvial fan in the valley is dry in the summer months.
The watershed supports a population of Steelhead trout, that migrate to and from the Pacific Ocean and the Bay during winter flows. Young Steelhead take refuge in the upper watershed until they have grown enough to migrate downstream.
Native American tribes thrived in the region for perhaps fifteen thousand years. Many archaeological resources are known to exist in the San Francisquito watershed. The San Francisquito watershed was home to the Lamchin tribe of the Ohlone peoples. European settlers arrived during the Mission period, which extended from 1769 until the mid-1800s. Missions raised cattle for hides and tallow, exporting these commodities to Mexico and Spain. Following the discovery of gold in the Sierra foothills, the European population expanded significantly. Land use in the region transitioned from cattle ranching to orchards and farming for the next century. The Bay Area, including the flat land portion of the San Francisquito watershed, began to urbanize after the early 1900s, a trend that accelerated sharply after the end of the second World War.
Historic Peak Streamflow Rates – San Francisquito Creek at USGS Gage 11164500
1930–1941; 1950–2023
Rank order – Date – Peak flow rate (cfs)
- February 3, 1998 – 7,200
- December 31, 2022 – 6,340
- December 22, 1955 – 5,560
- December 23, 2012 – 5,400
- January 4, 1982 – 5,220
- January 1, 2005 – 4,840
- February 7, 2017 – 4,820
- April 2, 1958 – 4,460
- March 21, 2023 – 4,080
- January 21, 1967 – 4,000
- February 13, 2000 – 3,930
- February 16, 1982 – 3,760
- December 16, 2002 – 3,660
- January 9, 2023 – 3,650
- November 18, 1950 – 3,650
- February 17, 1986 – 3,480
- January 26, 1983 – 3,420
- April 1, 1974 – 3,410
- January 16, 1973 – 3,390
- T. January 24, 1983 – 3,340
- T. March 10, 2023 – 3,340
Documents and links about the watershed
San Francisquito Watershed Council Vision, 2005Bank Stabilization Master Plan
Stanford University’s Habitat Conservation Plan
Oakland Museum’s Guide to San Francisco Bay Area Creeks
USGS Science Explorer: Exploring San Francisquito Creek
San Francisco Regional Water Quality Control Board, San Francisquito Creek Sediment TMDL
County of San Mateo, Public Works: Map of the San Francisquito Creek Watershed
Article: “Tour outlines shared challenges to San Francisquito Creek watershed”